

Standardised Non-Financial Risk Quantification and Reporting Framework
Risk Accounting measures the operational (non-financial) risk a business is carrying right now, in one standard, auditable unit — the Risk Unit (RU) — so it can be added up, compared, and reported like money.
An auditable, accounting-based framework that quantifies, aggregates, and values exposure to non-financial risks (operational risks), enabling non-financial risks to be managed with the same rigorous, double-entry discipline as credit and market risks.
The History and Evolution of Risk Accounting
Explore the emergence, history, and evolution of risk accounting to understand better how it appeared in alignment to the market's expectations.

The Risk Accounting Standards Board
The not-for-profit, risk accounting method custodian.
Click to learn more

Learn more about the Risk Accounting method...
...by reading Peter Hughes' book "Risk Accounting", available from Amazon.
Regulatory Capital & The Operational Risk Dilemma
CEOs such as JPMorgan Chase's Jamie Dimon have highlighted how operational risk capital requirements fail to reflect actual business risk or support economic growth.
Jamie Dimon’s critique underscores a fundamental limitation of conventional regulatory frameworks: historical loss models penalise balance-sheet size rather than measuring the operational controls and risk hygiene an institution maintains today.
Such industry concerns underscore the necessity for re-evaluating operational risk capital. Risk accounting emerges as a viable solution, offering an auditable, accounting-grade assessment aligned with evolving risks and supporting effective risk management strategies.
Issues with Current Op-Risk Capital
- Reliance on Historical Data: The prevalent reliance on historical loss data limits adaptability to emerging risks like cyber crime, potentially hindering economic growth.
- Neglect of Mitigation Quality: Current methods fail to incentivize transformative risk mitigation measures, as improvements may not reduce op risk capital requirements.
The Role of Risk Accounting
- Enhanced Operations: Risk accounting introduces standardised risk measurement, transparent reporting, and accurate economic profit calculations, fostering a proactive risk management approach.
- Comprehensive Risk Framework: Quantifying and monitoring risk metrics in real-time allows banks to assess risk management effectiveness and allocate resources efficiently.
- Improved Mitigation Strategies: Risk accounting facilitates the identification, assessment, and strategic management of various risks, promoting informed decision-making.
Forward-Looking Integration
- Forward-Looking Approach: Integrating risk accounting into op risk capital calculation ensures a calibrated and forward-looking perspective, considering the evolving risk landscape.
- Cultural Enhancement: By aligning risk and finance, risk accounting incentivizes proactive risk mitigation, fostering continuous improvement in risk management practices.
The Risk Accounting Method
Introducing the ‘Risk Unit’ or ‘RU’
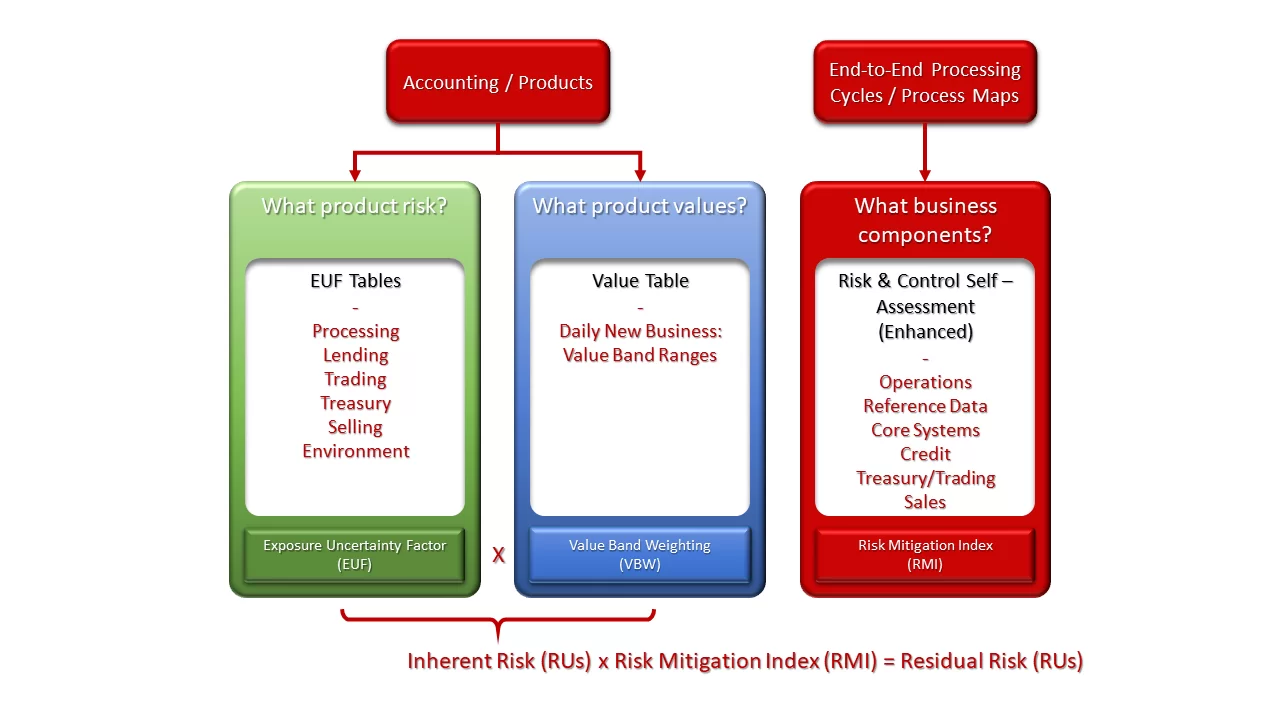
The Risk Unit, or RU, is the additive unit of measurement unique to the Risk Accounting method. It quantifies and reports exposure to operational risk (non-financial risk) using three core components:
- Exposure Uncertainty Factor (EUF): A calibrated factor scaled from 0 to 20 capturing product operational complexity.
- Value Band Weighting (VBW): An ascending weighting assigned to daily transactional volume throughput.
- Enhanced Risk & Control Self-Assessment (Enhanced RCSA): Objective, binary-verified control status evaluations that produce a percentage Risk Mitigation Index (RMI).
Portfolio Aggregation & Governance
Risk Accounting generates algorithms that convert EUF, VBW and RCSA (Enhanced) inputs into a portfolio view of operational risk exposures in RUs encompassing:
- The reporting and analysis of granular and aggregated exposures by multiple categories including group-wide, business line, business organisational component, product, and customer.
- Direct comparisons of exposure to operational risk through benchmarking and ranking within and between enterprises (assuming the above tables and associated risk factors are uniformly applied).
- Identification and prioritisation of risk mitigation action plans with a calculation of the projected risk reduction impact of each plan in RUs.
- The setting of operational risk budgets and risk operating limits in RUs across all vertical and horizontal dimensions of the enterprise with the potential for real- or near real-time monitoring of accumulating exposures to risk vs. risk budgets and limits.

Calculation of Inherent RUs & Method Pipeline
Risk Accounting calculates operational exposure in two foundational stages: first calculating gross baseline exposure (Inherent RUs), and then applying independently verified internal controls to determine net exposure (Residual RUs).
To illustrate how Risk Accounting operates end-to-end, follow a single banking transaction pipeline — Commercial Wire Transfers — through the complete mathematical method:
The resulting 7,700 Residual RUs can be directly aggregated with Residual RUs from mortgages, trading desks, and retail branches to give executive management and the Board a mathematically sound, audit-ready portfolio view.
1. Exposure Uncertainty Factor (EUF)
EUFs are scaled to a value between zero and 20 reflecting each product’s operational complexity and the consequent process burden it imposes on the enterprise. EUFs relative to the activities below, where applicable, are assigned according to the risk criteria and associated risk factors set out in the EUF tables and summed for each product:
- Processing: number of operational touchpoints along the product’s end-to-end processing cycle.
- Lending: the relative time and effort required to liquidate collateral in the event of a credit default with reference to the value retention properties and price stability of underlying collateral.
- Trading: the relative time and effort required to unwind a trading position with reference to the availability and reliability of market prices and rates, and the manner in which the product is traded, e.g., electronic, floor, OTC etc.
- Treasury: the relative time and effort required to fund a product and manage associated liquidity and interest rate risk with reference to:
- Banking book: interest rate type (fixed or floating) and maturity.
- Derivatives: relative degree of complexity.
- Transactional and trading book: assume marginal Treasury involvement.
- Selling: whether the product is…
-
- an investment product involving the holding of customer monies;
- directly linked to a sales incentive scheme; and
- bundled with other products (e.g., a loan with an interest rate swap);
- …and the product’s relative degree of complexity from a customer perspective.
-
- Environment: the product’s relative toxicity, combustibility, and biodiversity.
2. Value Band Weighting (VBW)
Ascending $ amounts of daily operational throughput, for each product, are assigned a Value Band Weighting (VBW).
The value bands plotted against the VBWs produce a logarithmic curve that depicts how the rate of change in risk decelerates as operational throughput accelerates, primarily due to enhanced automation that naturally occurs as production volumes and values increase.
3. Risk Mitigation Index (RMI) & Residual RUs
Two variable inputs are periodically input into Risk Accounting to produce RMIs and Residual RUs by multiple reporting categories including group-wide, business line, business component (cost centre), customer, product, legal entity, and location.
- The amount of operational throughput, being daily new business transacted relative to each product, which can be captured either manually or via automated interfaces with accounting systems.
- The status of risk mitigation gathered from across the enterprise via risk & control self-assessments (see below) captured at pre-selected organisational levels, e.g., process, production team, department, division etc.
Enhanced Risk & Control Self-Assessment (RCSA)
The traffic light ‘RAG’ assessments typically used in RCSAs to report the status of risk mitigation activities and processes are replaced either by a binary ‘yes/no’ input indicating the presence or absence of compliance with an industry consensus best practice or through gauging the degree of compliance by reference to a set of predetermined benchmarks. RCSA enhanced inputs are used by Risk Accounting’s algorithms to calculate risk mitigation indexes (RMIs) and residual RUs.

Auditability & Standardisation
An important feature of Risk Accounting is that Risk Accounting inputs via EUF and VBW tables and enhanced RCSAs are auditable:
- EUFs are set and approved during the product approval and review process. Auditors can independently verify that EUFs have been appropriately documented, approved, and consistently applied.
- Operational throughput and mapping to the Value Table can be independently verified by auditors against accounting records.
- Given that enhanced RCSAs require either a ‘yes/no’ response or the selection of a benchmark from a multiple-choice dropdown box, an auditor can independently verify whether responses are appropriate as there is only one acceptable response.
Historical Context: The 2007/8 Crisis & Invisible Non-Financial Risk
During the financial crisis of 2007/8, financial institutions of all sizes around the globe suffered material, sometimes catastrophic unexpected losses. These were invariably due to their inability to effectively identify, quantify, aggregate, and report their internal exposures to non-financial risks. In many instances, the result was extreme accumulations of unidentified and unreported exposures that eventually turned into balance-sheet losses. In contrast, external exposures to financial risks have intrinsic monetary value that can be readily quantified in natural currency, aggregated, and reported. In short, an institution’s exposure to external financial risks is typically known, whereas its exposure to internal non-financial risks is typically invisible.
Core Terminology & Definitions
The Risk Accounting method uses precise, accounting-grade definitions to distinguish non-financial exposure from financial risk and subjective estimates:
Risk Unit (RU):
The standard, additive unit of non-financial risk measurement unique to Risk Accounting. RUs quantify exposure across products, departments, and legal entities so that operational risk can be aggregated and reported like money.
Exposure Uncertainty Factor (EUF):
A calibrated factor on a 0–20 scale assigned to each banking or corporate product, reflecting its inherent operational complexity, vulnerability to error, and process burden.
Value Band Weighting (VBW):
Ascending weightings assigned to daily operational throughput (transaction volume), reflecting non-linear risk escalation as transaction volume increases.
Risk Mitigation Index (RMI):
The percentage effectiveness of operational controls (0% to 100%) calculated via enhanced, binary-verified Risk & Control Self-Assessments (RCSAs).
Non-Financial (Operational) vs. Financial Risk:
Exposure to non-financial risks exists where an institution fails to adequately plan, organise, manage, and control its internal processes. In contrast, financial risks (credit, market, liquidity) exist where an institution intentionally takes external positions with counterparties for a projected return.
Expected vs. Unexpected Losses:
Expected losses are stochastically determined accounting estimates of projected outcomes associated with accepted risks within Board-approved appetite limits. Unexpected losses stem from failure to accurately identify, quantify, and report accumulating exposures to non-financial risks.

Governance & Standards Custodianship
Risk Accounting Standards Board (RASB)
The global standards-setting organisation for Risk Accounting is the Risk Accounting Standards Board (RASB). The Board is comprised of leading industry practitioners, risk executives, and academic researchers dedicated to continuous improvement and independent oversight of risk exposure quantification standards.
Empirical Research & History of Risk Accounting
Key Empirical Validation & Academic Research
- University of Strathclyde Business School (Validation Study): An 18-month simulation and testing program conducted by the Department of Accounting and Finance confirmed that the Risk Accounting calculation engine mirrors empirical loss distributions without reliance on lagging internal loss databases.
- Hughes, P. J. & Marzouk, M. (2021) – Journal of Risk Management in Financial Institutions, 14(2), 173–194: "A test of the inherent predictiveness of the RU, a new metric to express all forms of operational risk in banks." Empirically tested accounting and transaction data from major U.S. banks in the period leading into the 2007–2008 financial crisis, proving that rising Risk Unit levels provided predictive advance warnings of operational stress prior to balance-sheet loss realisation.
- Butler, T. & Brooks, R. (2024) – Paradigm Shift Paper: "Time for a paradigm change: Problems with the financial industry’s approach to operational risk." Prof. Tom Butler (University College Cork / GRCTC) details the structural breakdown of conventional operational risk models and establishes why forward-looking, standardised Risk Accounting is essential for financial resilience and digital transformation.
Evolution of Risk Accounting

Risk Accounting: The Key to Restoring Confidence in Global Banking
The Evolution of Risk Accounting Risk Accounting: The Key to...

Building the Infrastructure for Risk Accounting: A Roadmap for the Future
The Evolution of Risk Accounting Building the Infrastructure for...

Jamie Dimon vs. Basel III: The Impact of Operational Risk Capital Requirements on Banking
The Evolution of Risk Accounting Jamie Dimon vs. Basel III: The...

Risk Accounting in Practice: How It Could Have Prevented the Collapse of Silicon Valley Bank
The Evolution of Risk Accounting Risk Accounting in Practice: How It...

The Business Indicator: A Proxy for Operational Risk or a Missed Opportunity?
The Evolution of Risk Accounting The Business Indicator: A Proxy for...

Professor Tom Butler’s Call for a Paradigm Change: The Case for Risk Accounting
The Evolution of Risk Accounting Professor Tom Butler's Call for a...

Operational Risk Management Today: Insights from the McKinsey & Co. and ORX Report
The Evolution of Risk Accounting Operational Risk Management Today:...
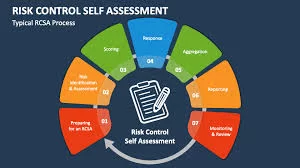
Risk & Control Self-Assessment (RCSA): Why the Banking Sector Needs More Than Just Traffic Lights
The Evolution of Risk Accounting Risk & Control Self-Assessment...

The Rise and Fall of the Advanced Measurement Approach (AMA) in Operational Risk Management
The Evolution of Risk Accounting The Rise and Fall of the Advanced...

Understanding Basel II: The Basel Committee’s Challenge to Banks on Operational Risk
The Evolution of Risk Accounting Understanding Basel II: The Basel...

The Call for Risk Accounting: Lessons from Professor Andrew Lo
The Evolution of Risk Accounting The Call for Risk Accounting:...

The Evolution of Financial Risk Management: From Black-Scholes to Risk Accounting
The Evolution of Risk Accounting The Evolution of Financial Risk...

Better Grasping the Future of Risk Management with Risk Accounting
The Evolution of Risk Accounting Better Grasping the Future of Risk...